
The Math Behind Stage 1 of Remote Viewing
We released advanced statistics in the First Impression trainer.
This is an essential tool for practicing the 1st Stage of Remote Viewing.
Now you can track your progress across various metrics.
Furthermore, you can break down the data across each gestalt.
Metrics
These metrics are used in mathematical statistics. We decided to use several because each highlights a slightly different angle.
1. Accuracy
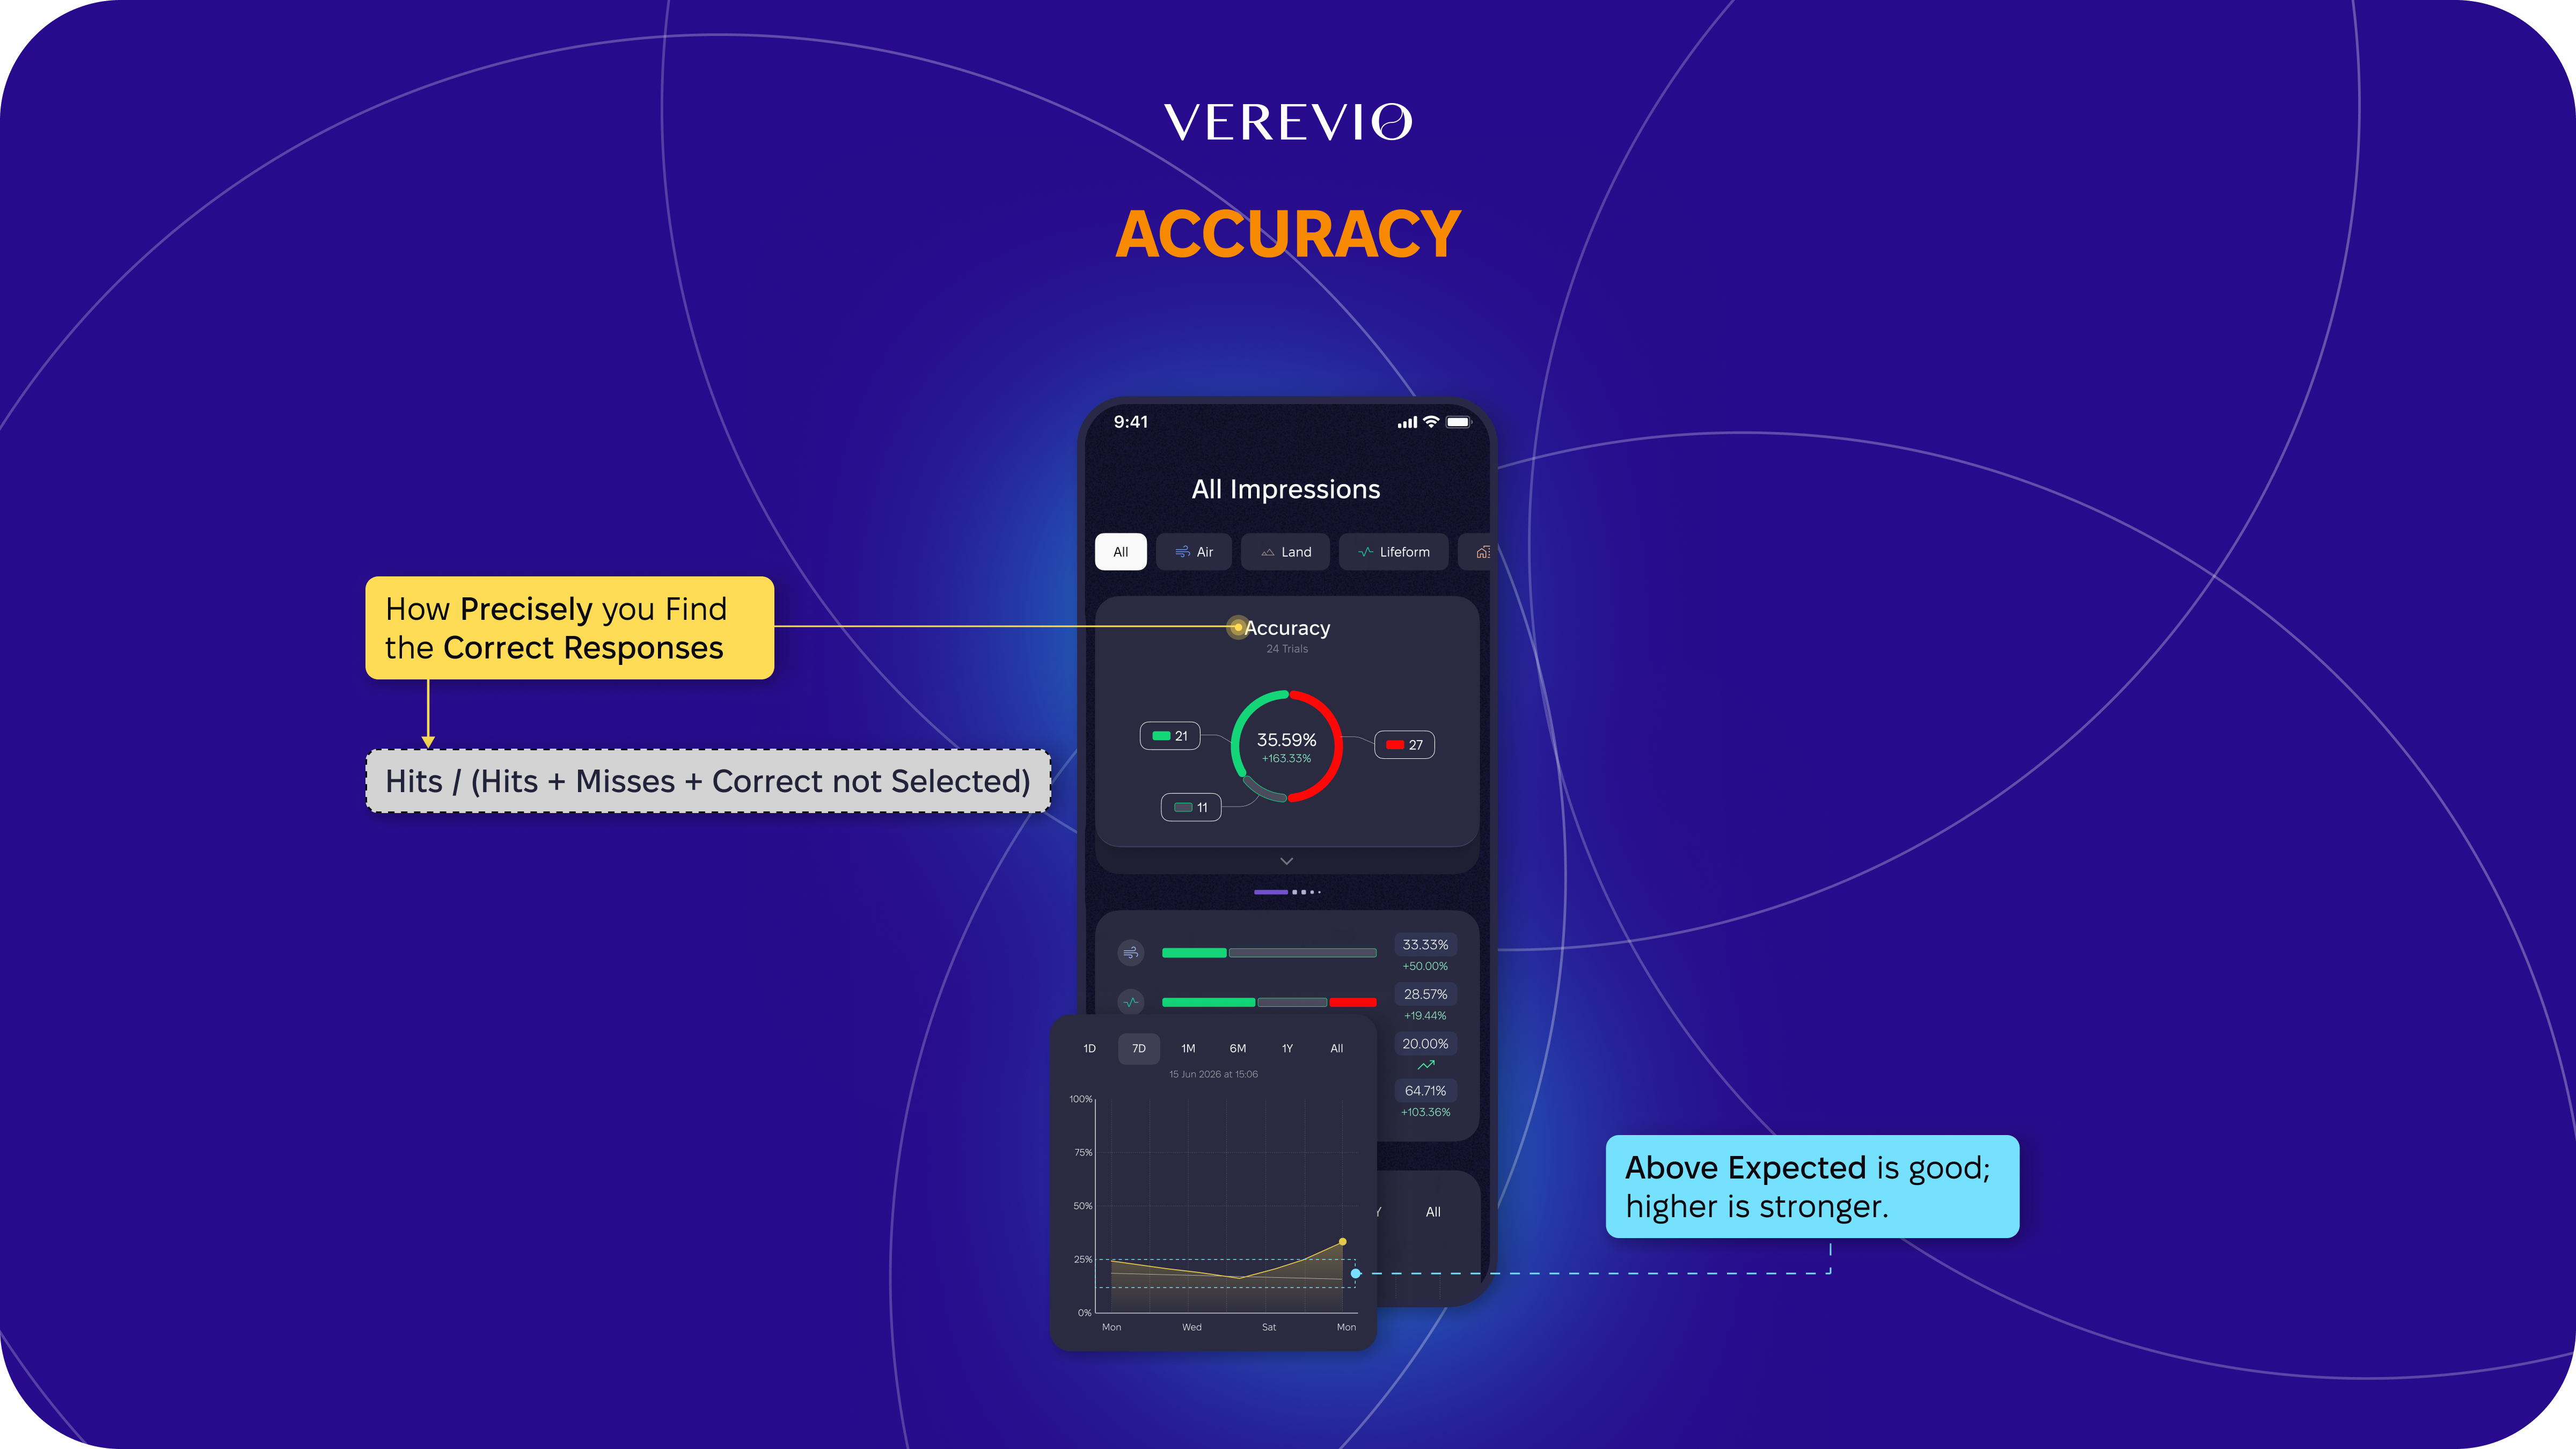
How accurate am I?
Shows how well you identified correct responses.
The max is 100%, which means you selected all the correct responses, with no misses and no correct responses left unselected.
The formula for the value:
Hits / (Hits + Misses + Correct not Selected)
Example: You pick 3 responses, 2 are correct, but there's 1 more correct response you didn't pick. That missed one still lowers your score.
A raw Accuracy number means little on its own. Getting 1 correct response out of 7 is different from getting 3 out of 7.
Tip: Compare your results to the white line on the dynamic graph (Accuracy, Hits Identified, Hit Miss). It's the Expected Probability, and it changes every round because each round has a different combination of correct responses. Anything above the line is a good result.
2. Hits Identified
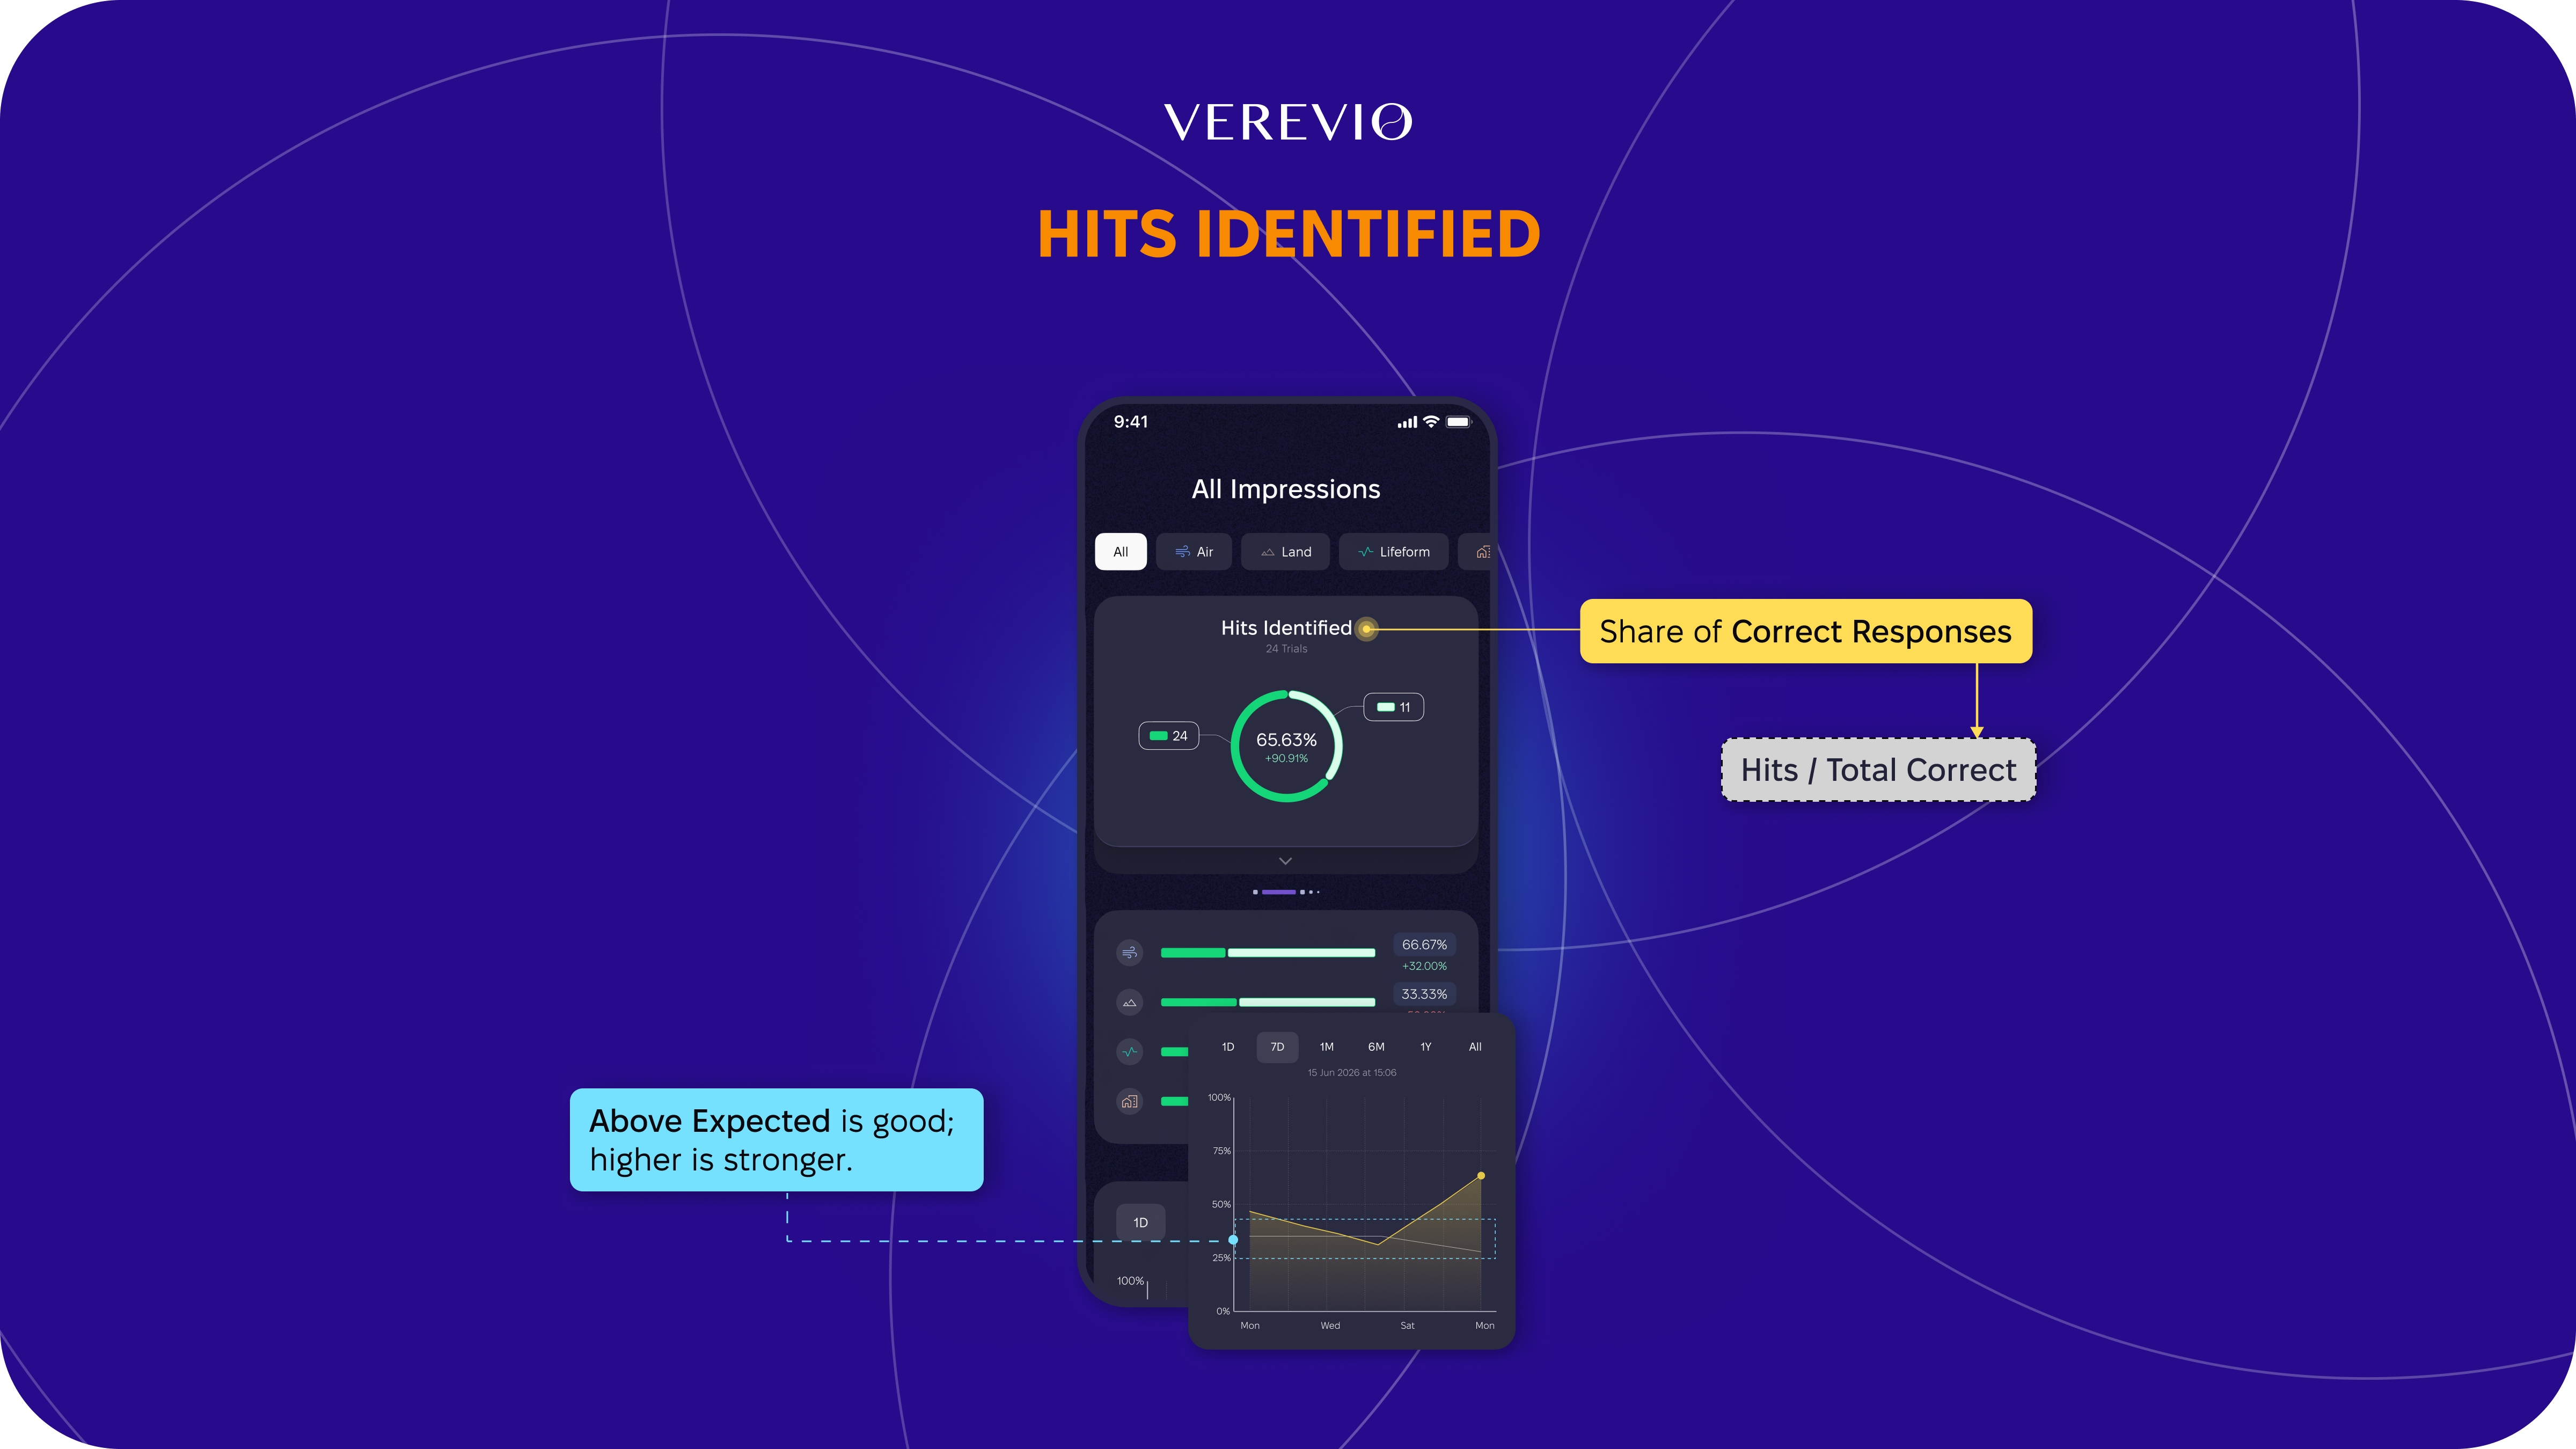
Am I always right?
Shows what share of all correct responses you identified.
The max is 100%, which means you got all the correct responses.
The formula for this value:
Hits / Total Correct Responses
Example: There were 5 correct responses total, and you caught 3 of them. Your score here is 3/5, regardless of how many wrong picks you also made along the way.
3. Hit Miss
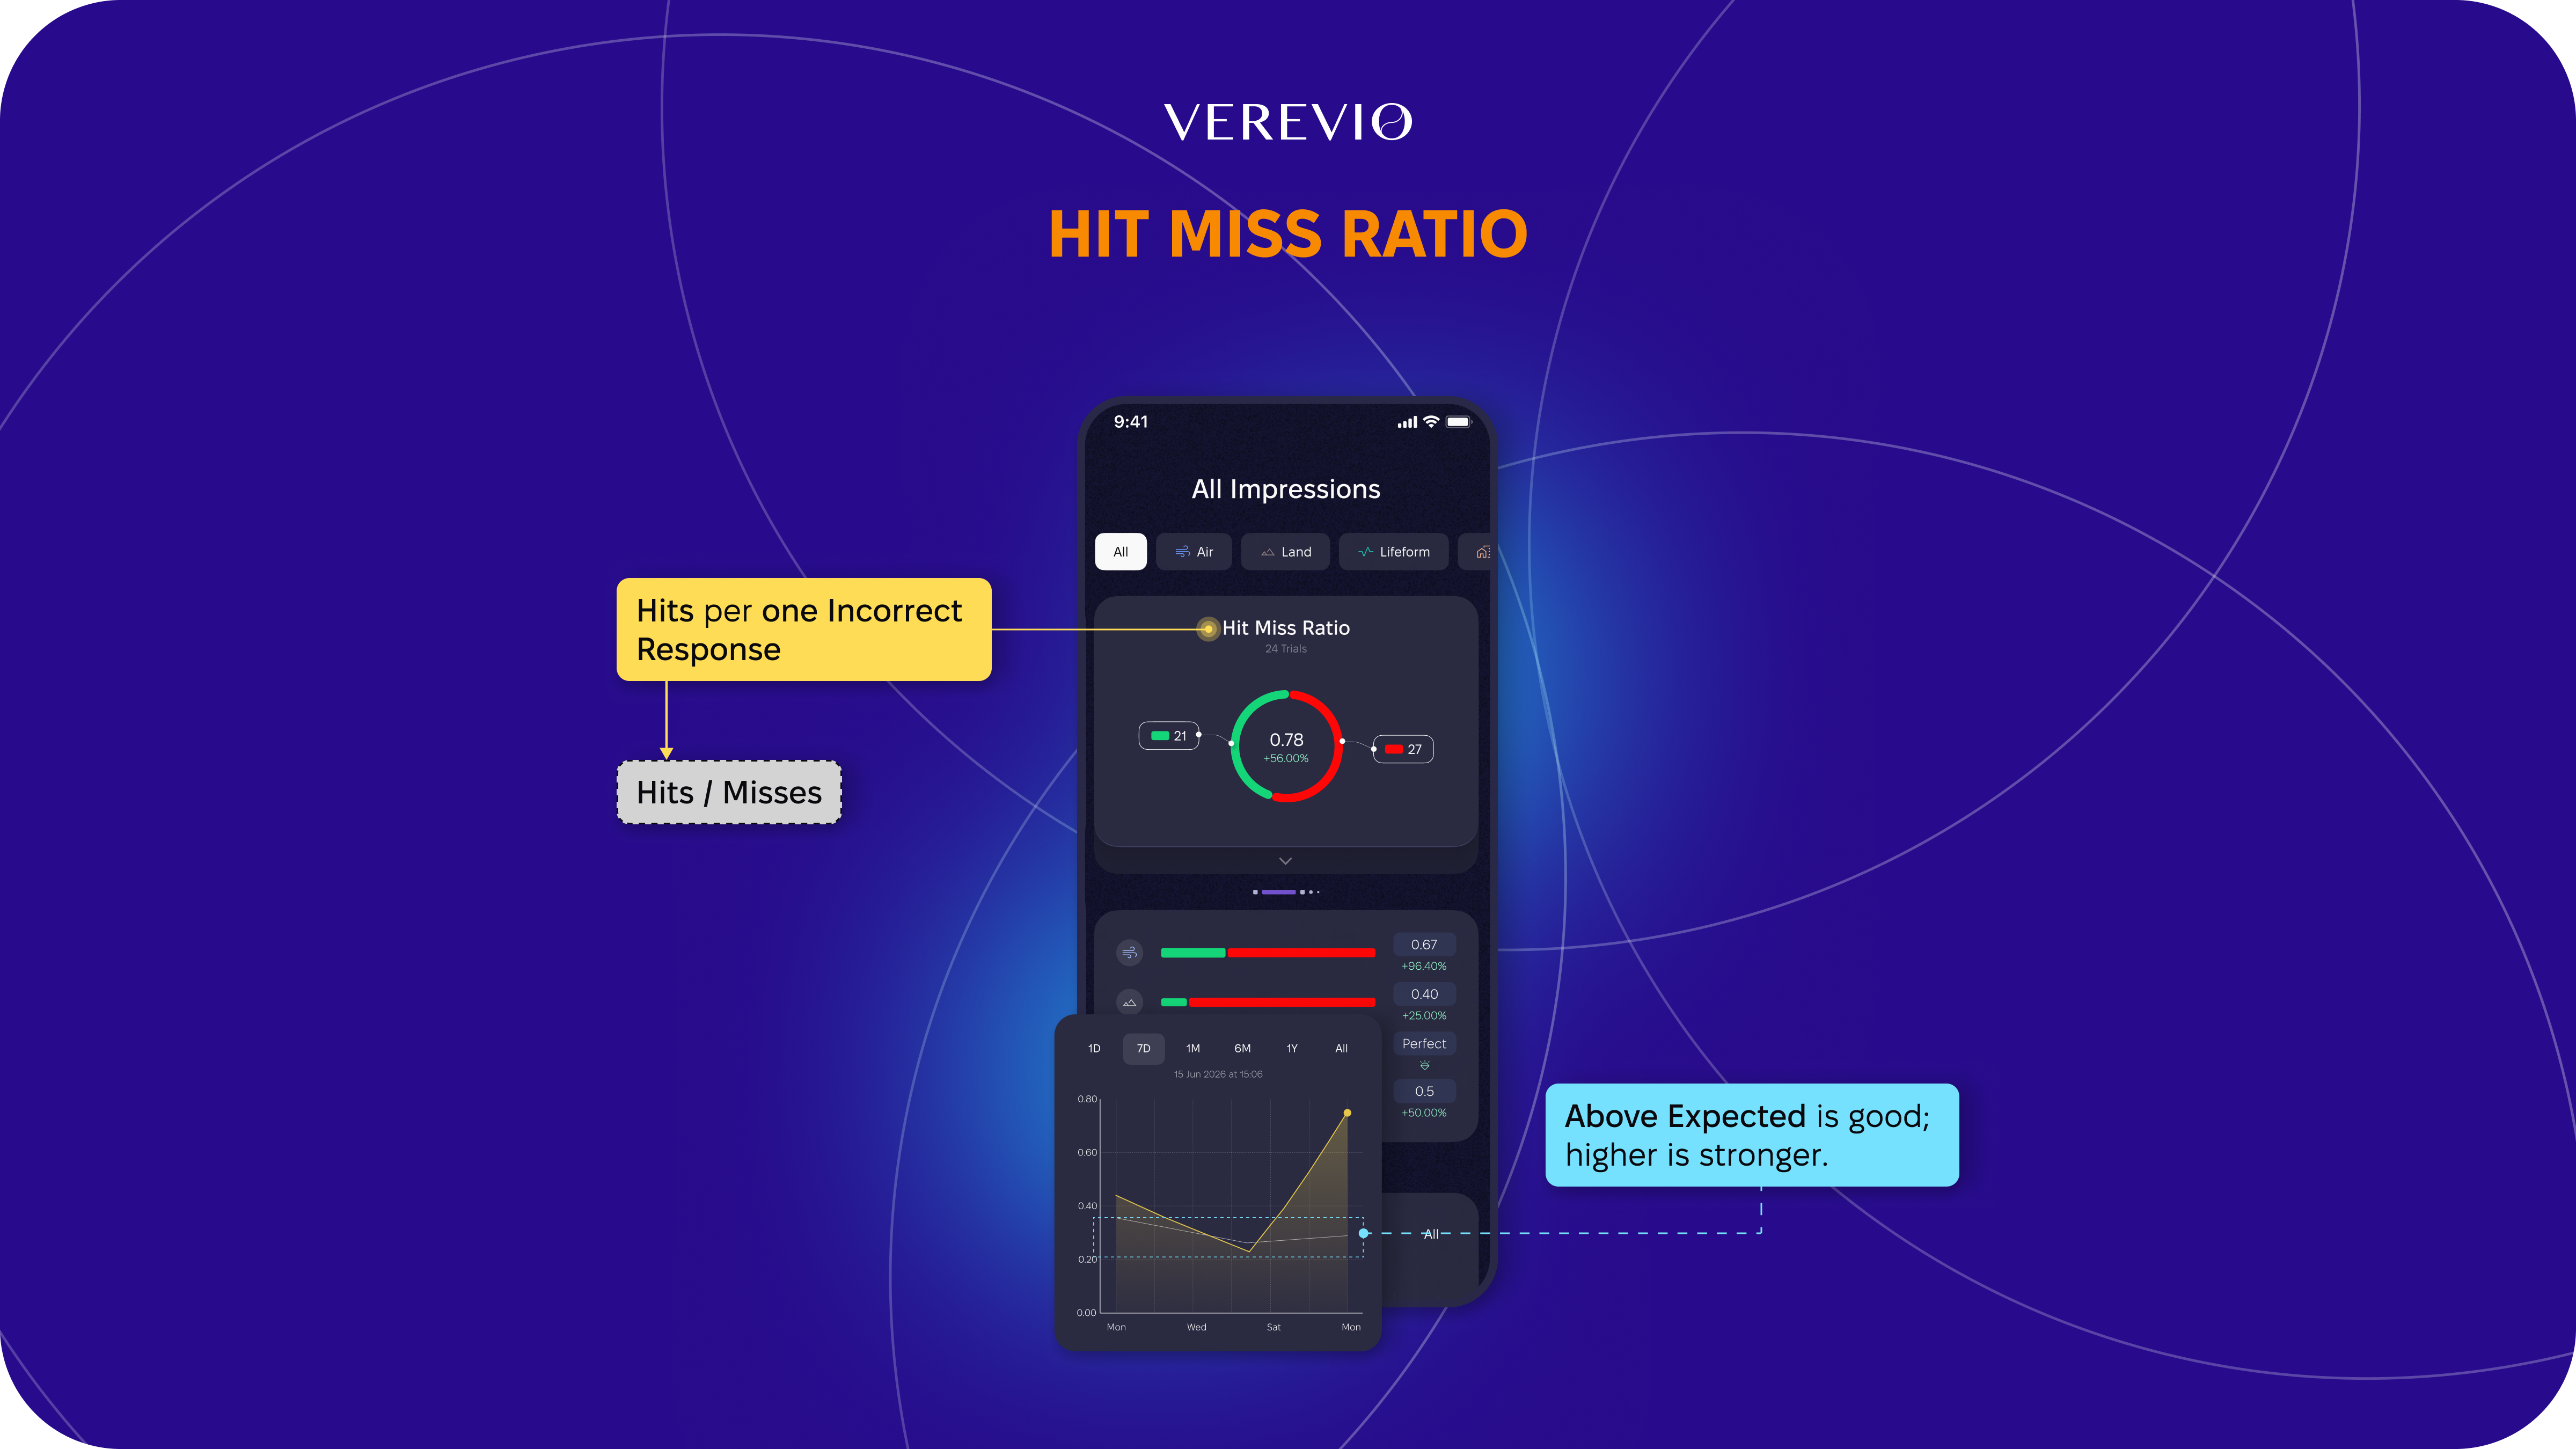
How many hits do I make per one miss?
Misses are a very important part of the process.
Nobody knows yet whether it is better to make 10-20 hits in 1 month with 0 misses or 100-200 hits with 300-400 misses.
I'd tend towards the second one.
The formula:
Hits / Misses
Example: You made 5 hits and 2 misses. Your ratio is 2.5, meaning you made 2.5 hits for every miss.
There's no maximum. If you have 0 misses, the ratio can't be calculated because of division by zero. In such cases, we show your total number of hits instead. It means you're a rock star.
4. Chance Expectation (z-score)
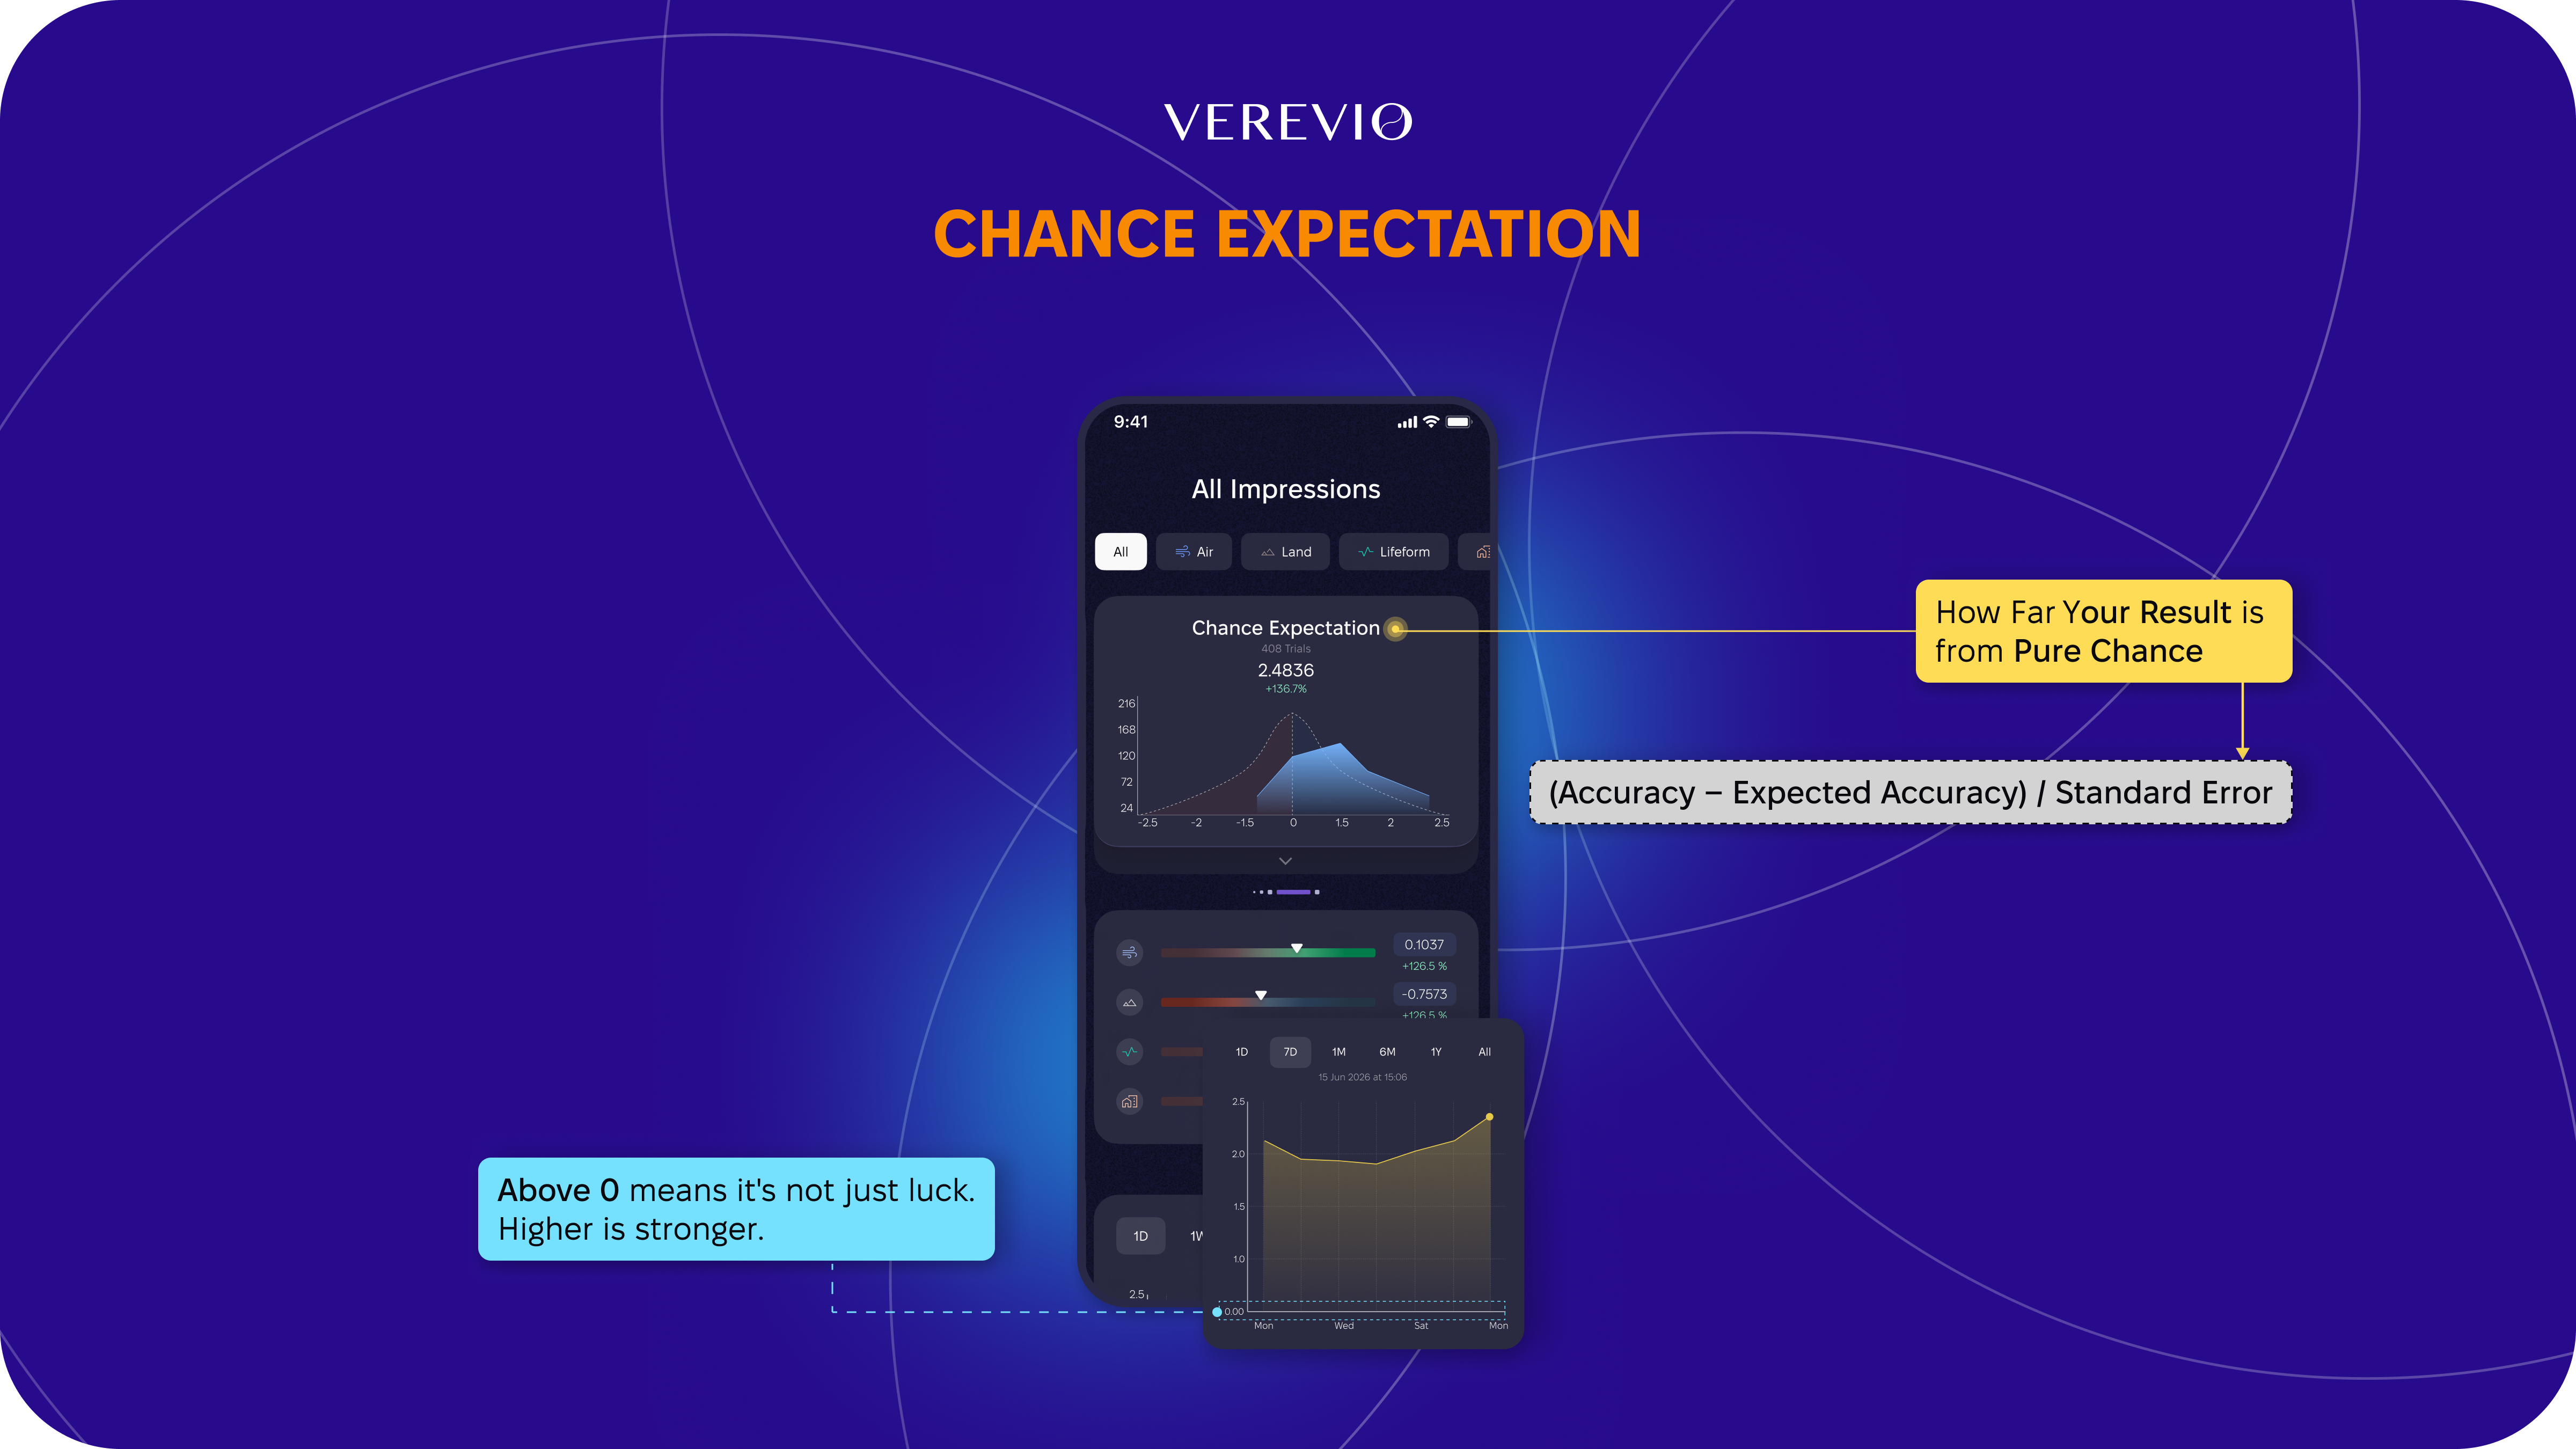
Am I doing better than chance?
Shows how far your result is from a random guess.
In statistics, this is called a z-score.
It usually falls between −3 and +3.
The formula for this value:
(Accuracy − Expected Accuracy) / Standard Error
Example: A z-score of 0 means you performed exactly like a random guesser. Anything above 0 is good. A z-score of 2 means you performed meaningfully better than chance, far enough that it's unlikely to be luck. The higher the z-score, the stronger the result.
This metric needs enough trials to give you a more stable comparison against chance. One trial alone is too random to tell you much. The more trials you do, the more reliable the result becomes. That's why we calculate it cumulatively after 72 trials, which is 3 rounds.
Tip: Keep your Chance Expectation (z-score) value above 0 in the long run. The dynamic graph always shows the aggregated trend.
5. Random Probability (p-value)
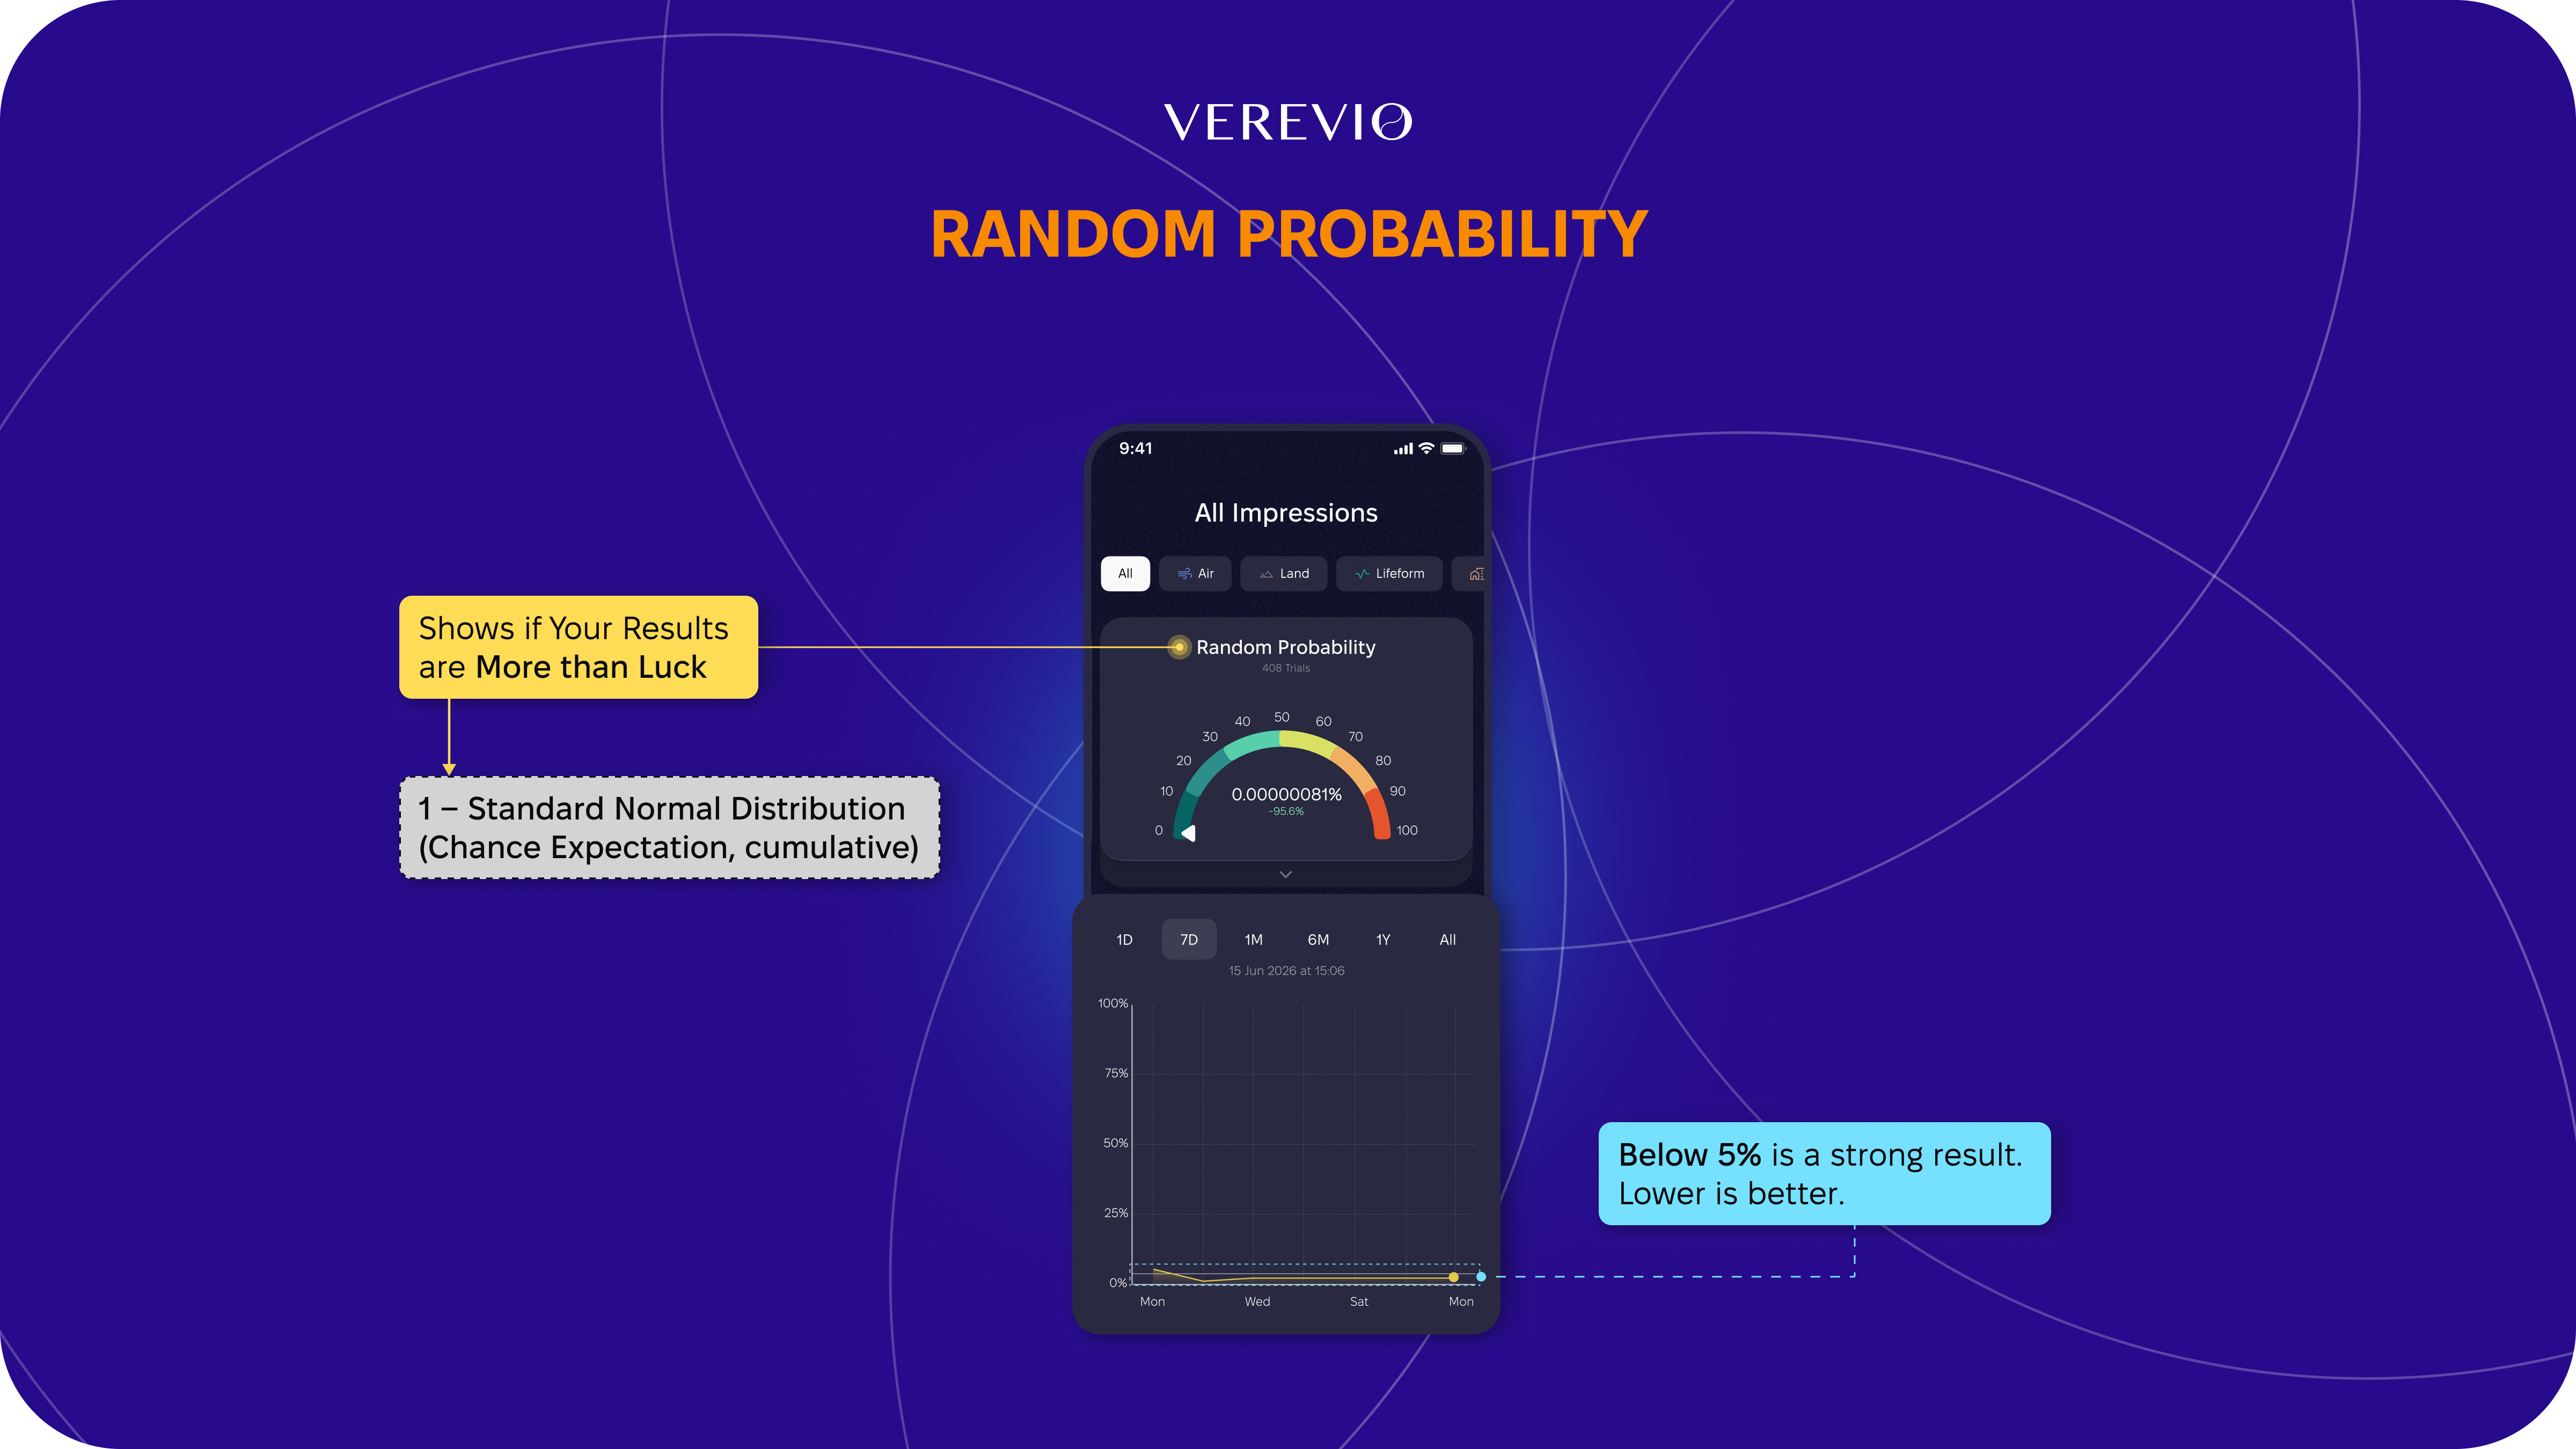
Am I right by accident?
Shows how likely you are to get this result by chance.
A generally accepted threshold in scientific research is 5%. Anything below 5% can be treated as evidence.
The formula is:
1 − Standard Normal Distribution (Chance Expectation, cumulative)
Example: A p-value of 5% means only 5 out of 100 random guessers would score as well as you did. A p-value of 50% means half of them would — meaning your result is nothing special.
We show the first p-value after 72 trials, which is 3 rounds. If you get 5% or lower, that means you're doing amazing.
Tip: Aim for below 5% on Random Probability (p-value) in the long run. Same here: the dynamic graph is always aggregated.
Multiple Choice Probability
Keep in mind we track multiple choice probability. That means multiple hits, misses, and unselected correct responses are possible.
Selecting everything or nothing won't give you success.
Both worsen your Accuracy, reduce your Chance Expectation (z-score), make your Random Probability (p-value) less significant, and distort individual metrics such as Hits Identified and Hit Miss Ratio.
And, of course, breakdowns!
This makes the calculations far more complex and much harder to manipulate or calculate manually.
Some of our users have already appreciated seeing the first impressions (gestalts) they're good at and the ones they underperform on.
And... Don't skip practice. Soon we'll ship a major release for real-time events.
Comments
0No comments yet. Be the first to comment!